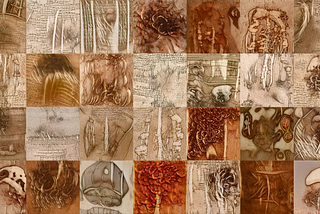
Yaël van EngelenHow I used Machine Learning to create an artwork with my hero, Leonardo da VinciThis article is the continuation of earlier experiments in which we created ‘dAI Vinci’, a Machine Learning model trained to create new…5 min read·Feb 24, 2022----
Yaël van EngelenExpert views on data literacy and alternative forms of data visualisationAs a designer I see great potential in visually combining qualitative and quantitative data, and thus in teaching visual thinkers to…5 min read·Nov 9, 2020----
Yaël van EngelenStories told by DataWhen we talk about data, they are actually not more than cumbs of properties. It is therefore not surprising that topics like big data are…3 min read·Oct 7, 2020----
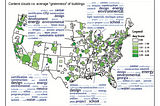
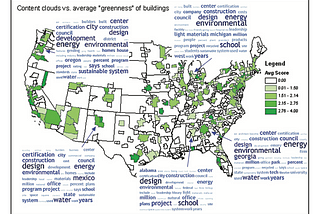
Yaël van EngelenMerging Diagrams and IllustrationsUsing illustrative elements to integrate data, and the dangers of interpretation3 min read·Oct 1, 2020----
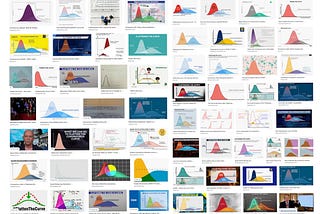
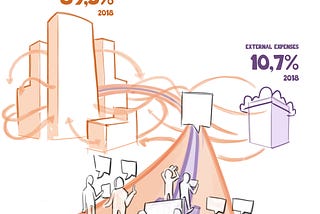
Yaël van EngelenMore than an InfographicData visualisation does not need to be boring, sequential or based on bold percentage statements.3 min read·Sep 29, 2020----
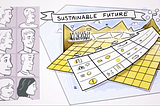
Yaël van EngelenExplaining Socio-Technical SystemsWhy we need Visual Communication of Qualitative and Quantitative Data4 min read·Sep 24, 2020----